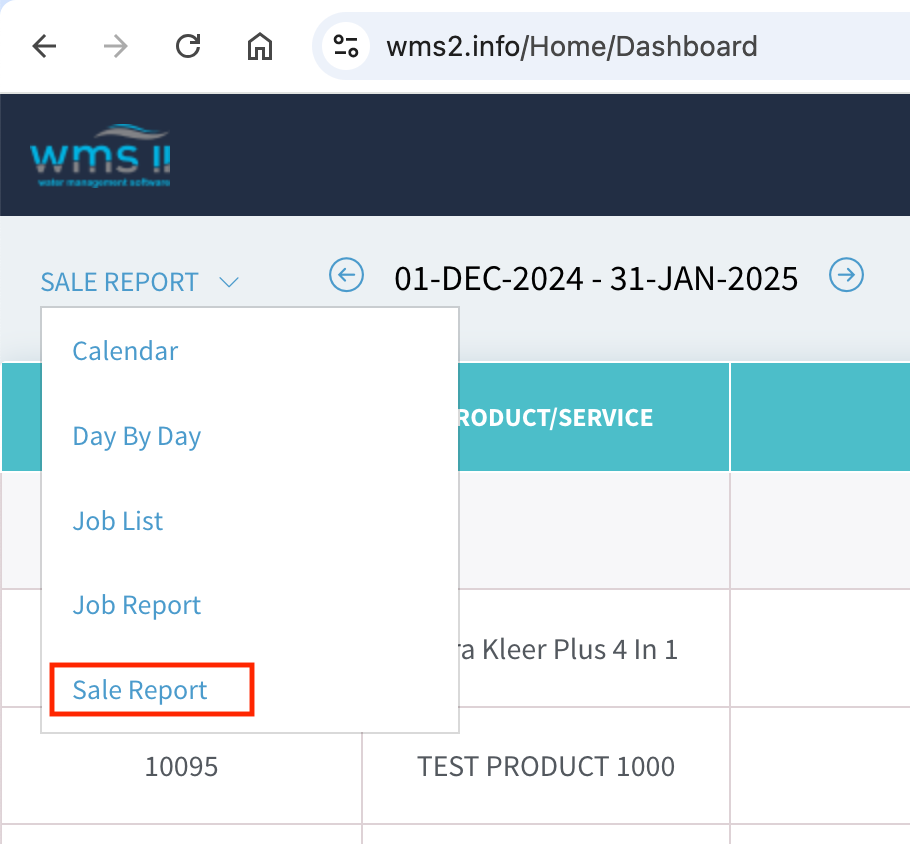
To run a sales report, go to the menu at the top left of the screen and select Sales Report
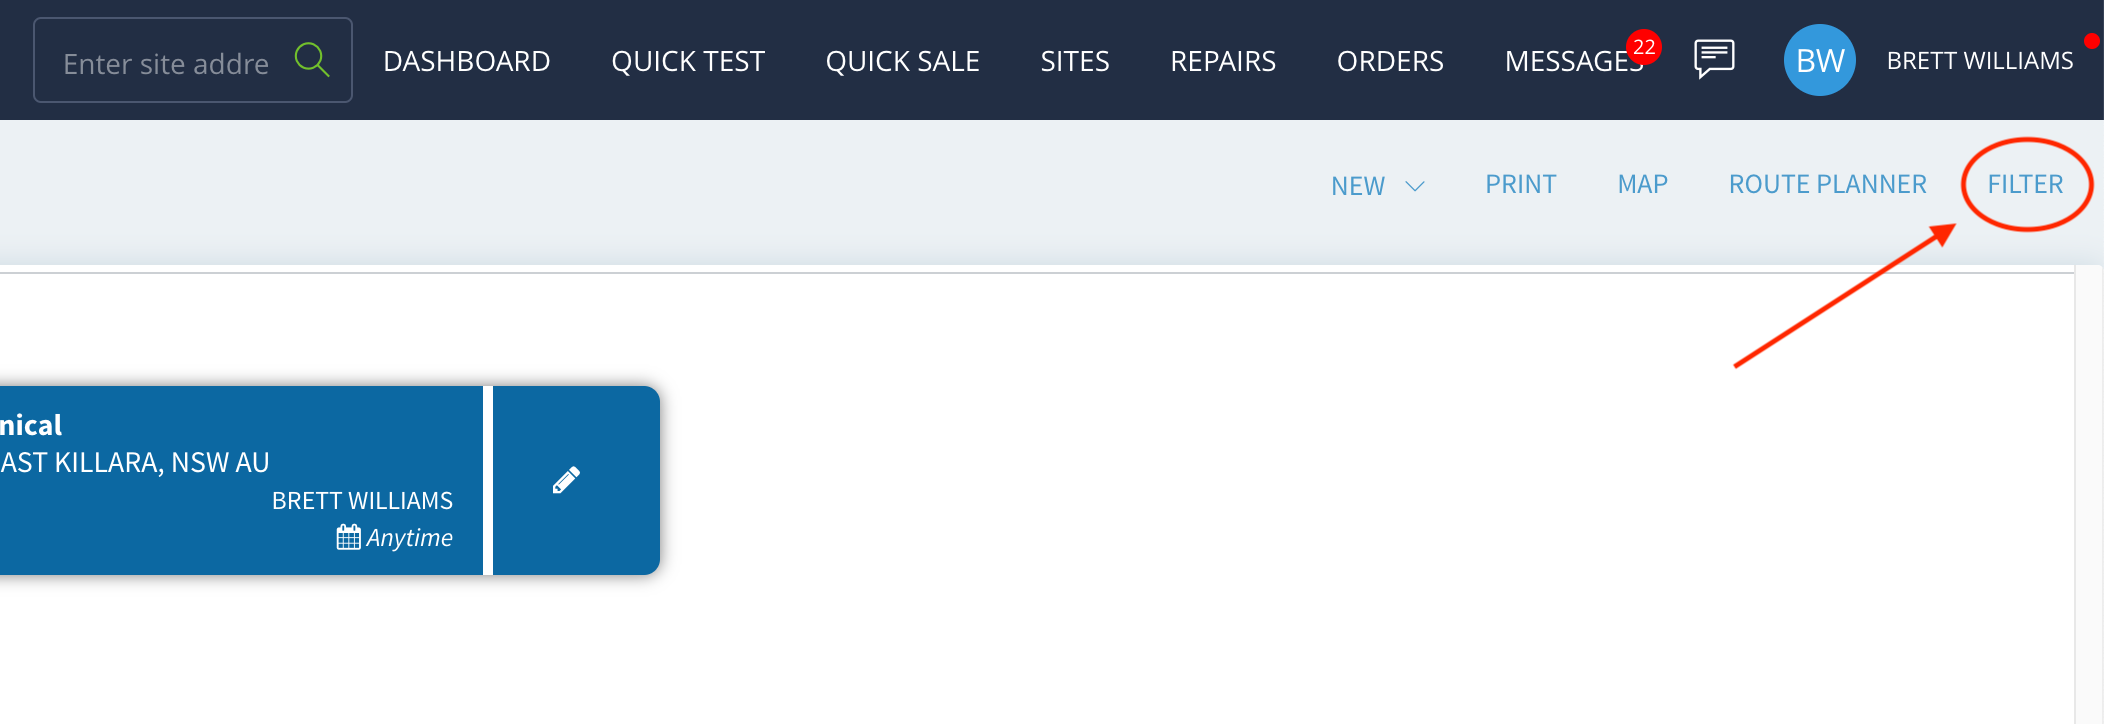
Then go to the Filter and set up the criteria for your report
In this example I am going to filter by Staff Member
Here you can choose to Clear All and select specific Staff Members to view in your sales report or you can Select All as I have done in this example
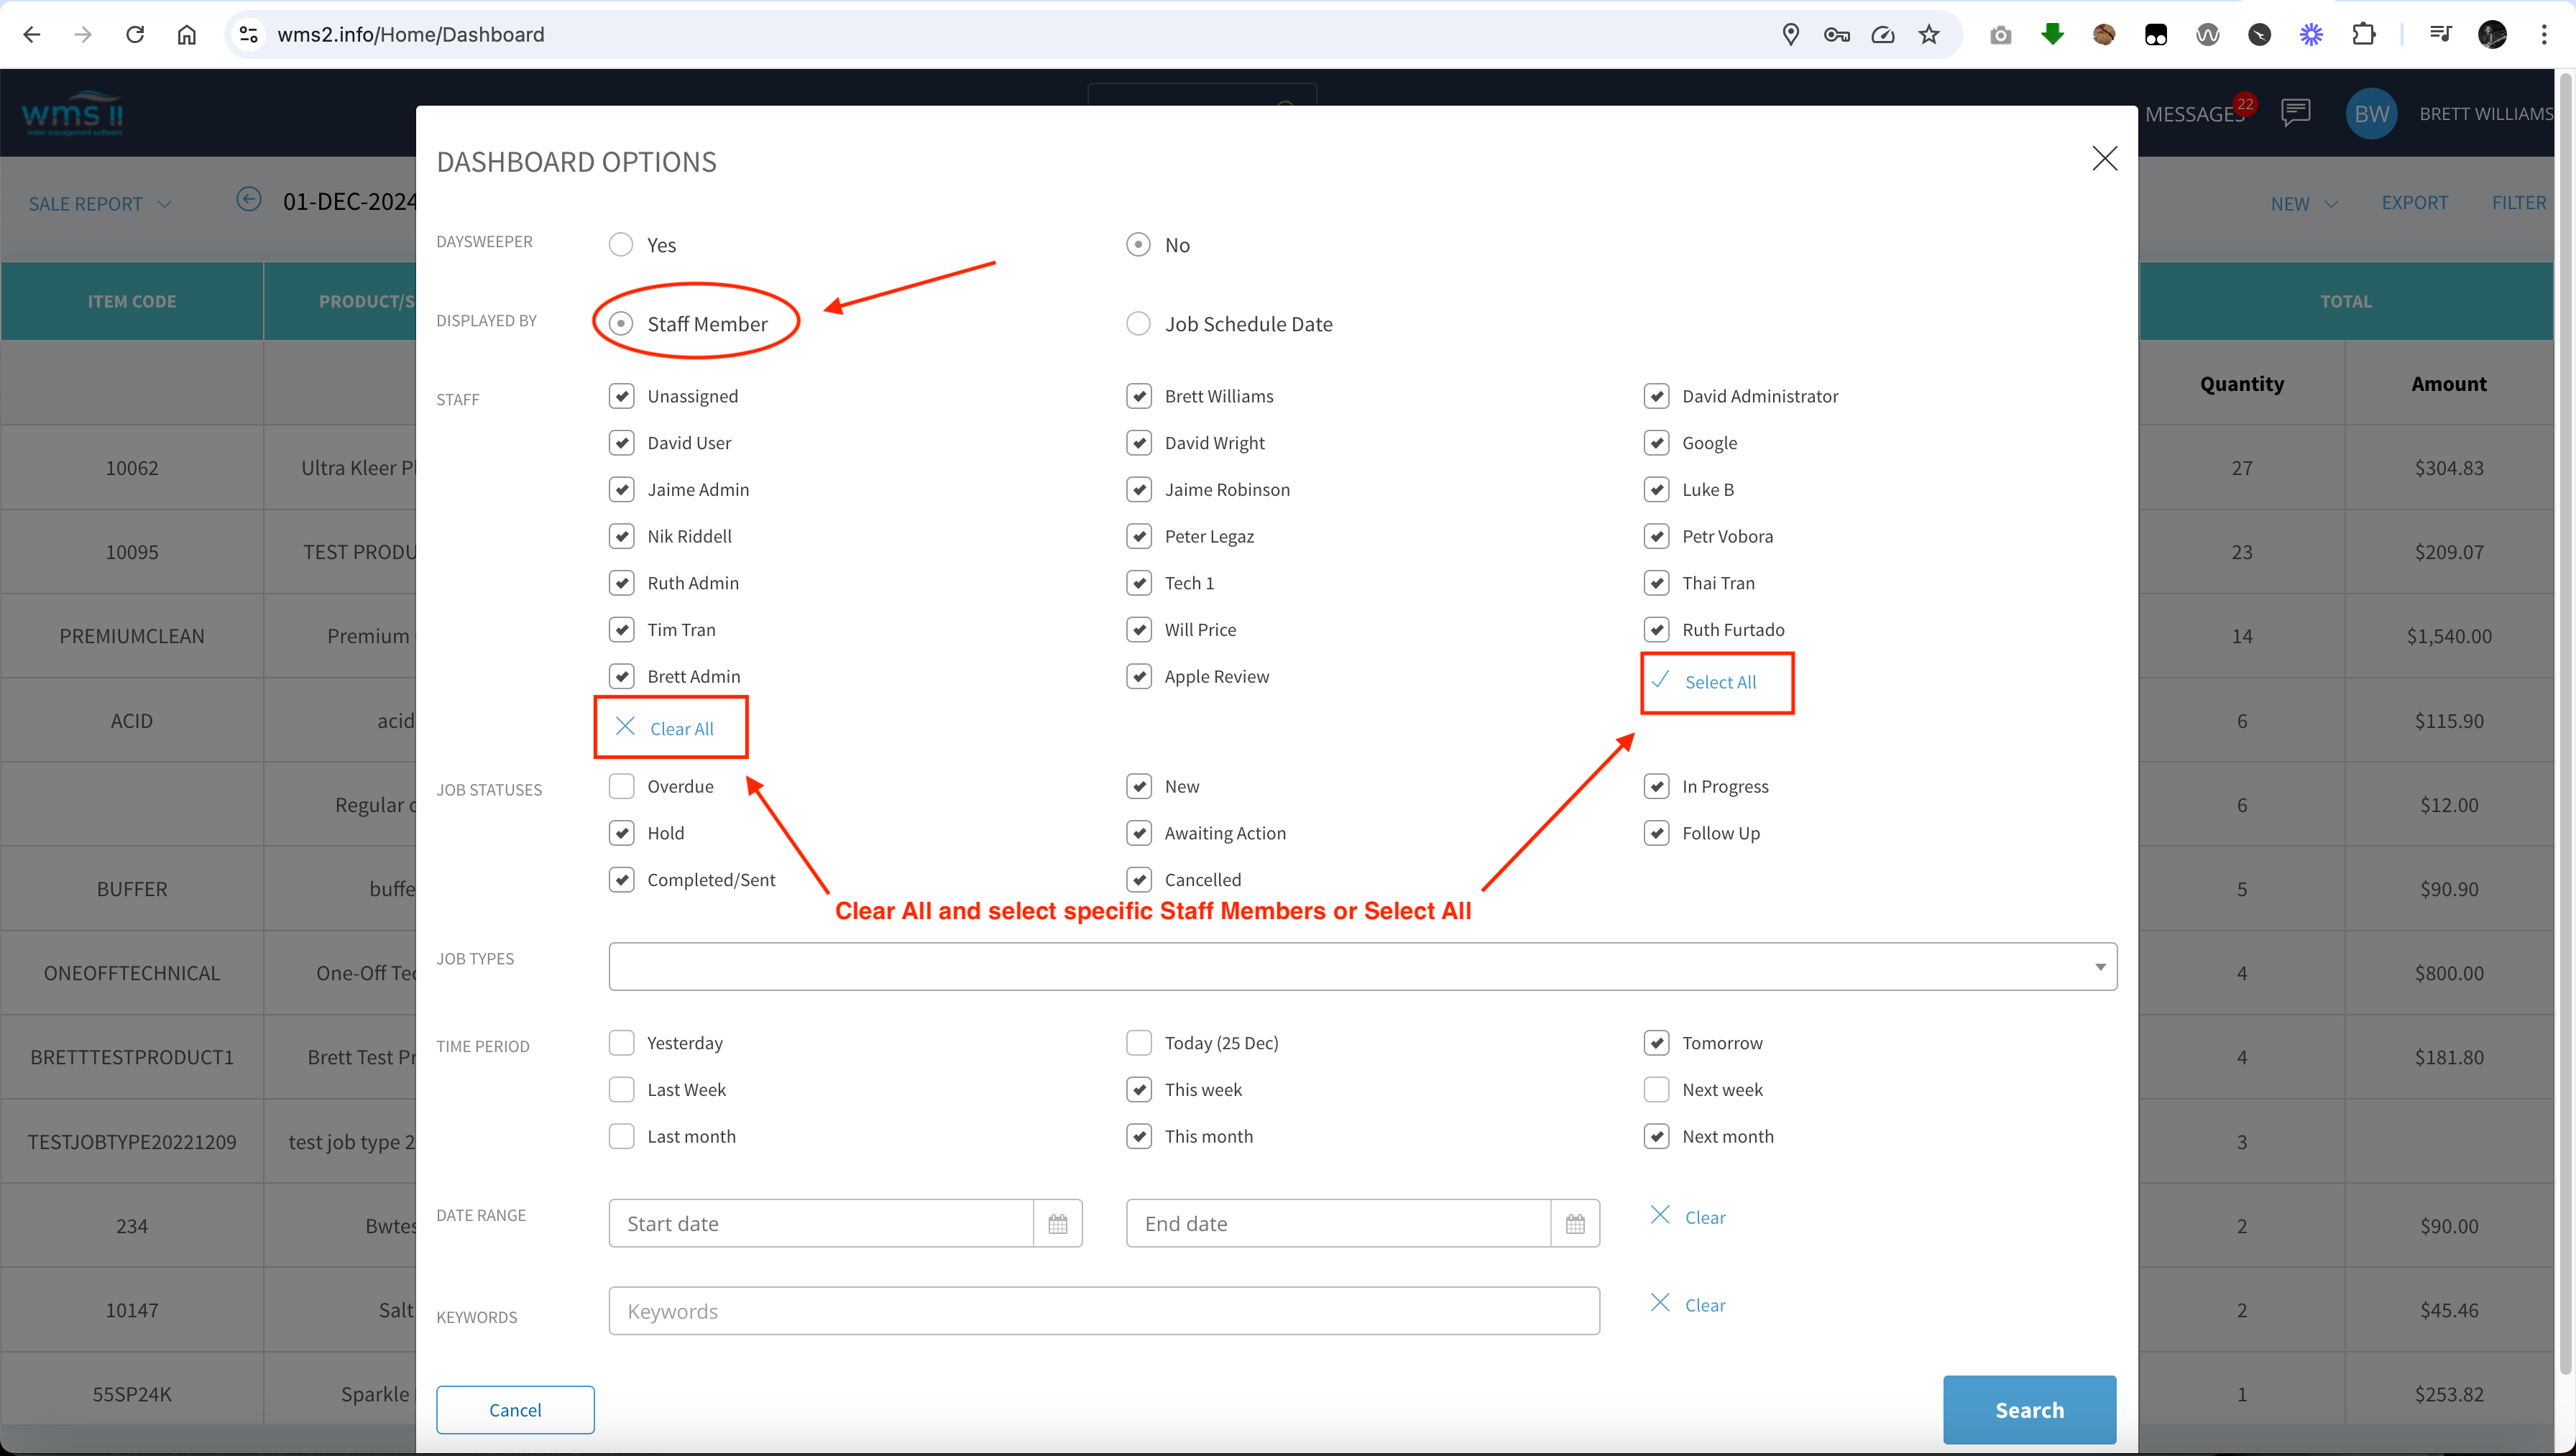
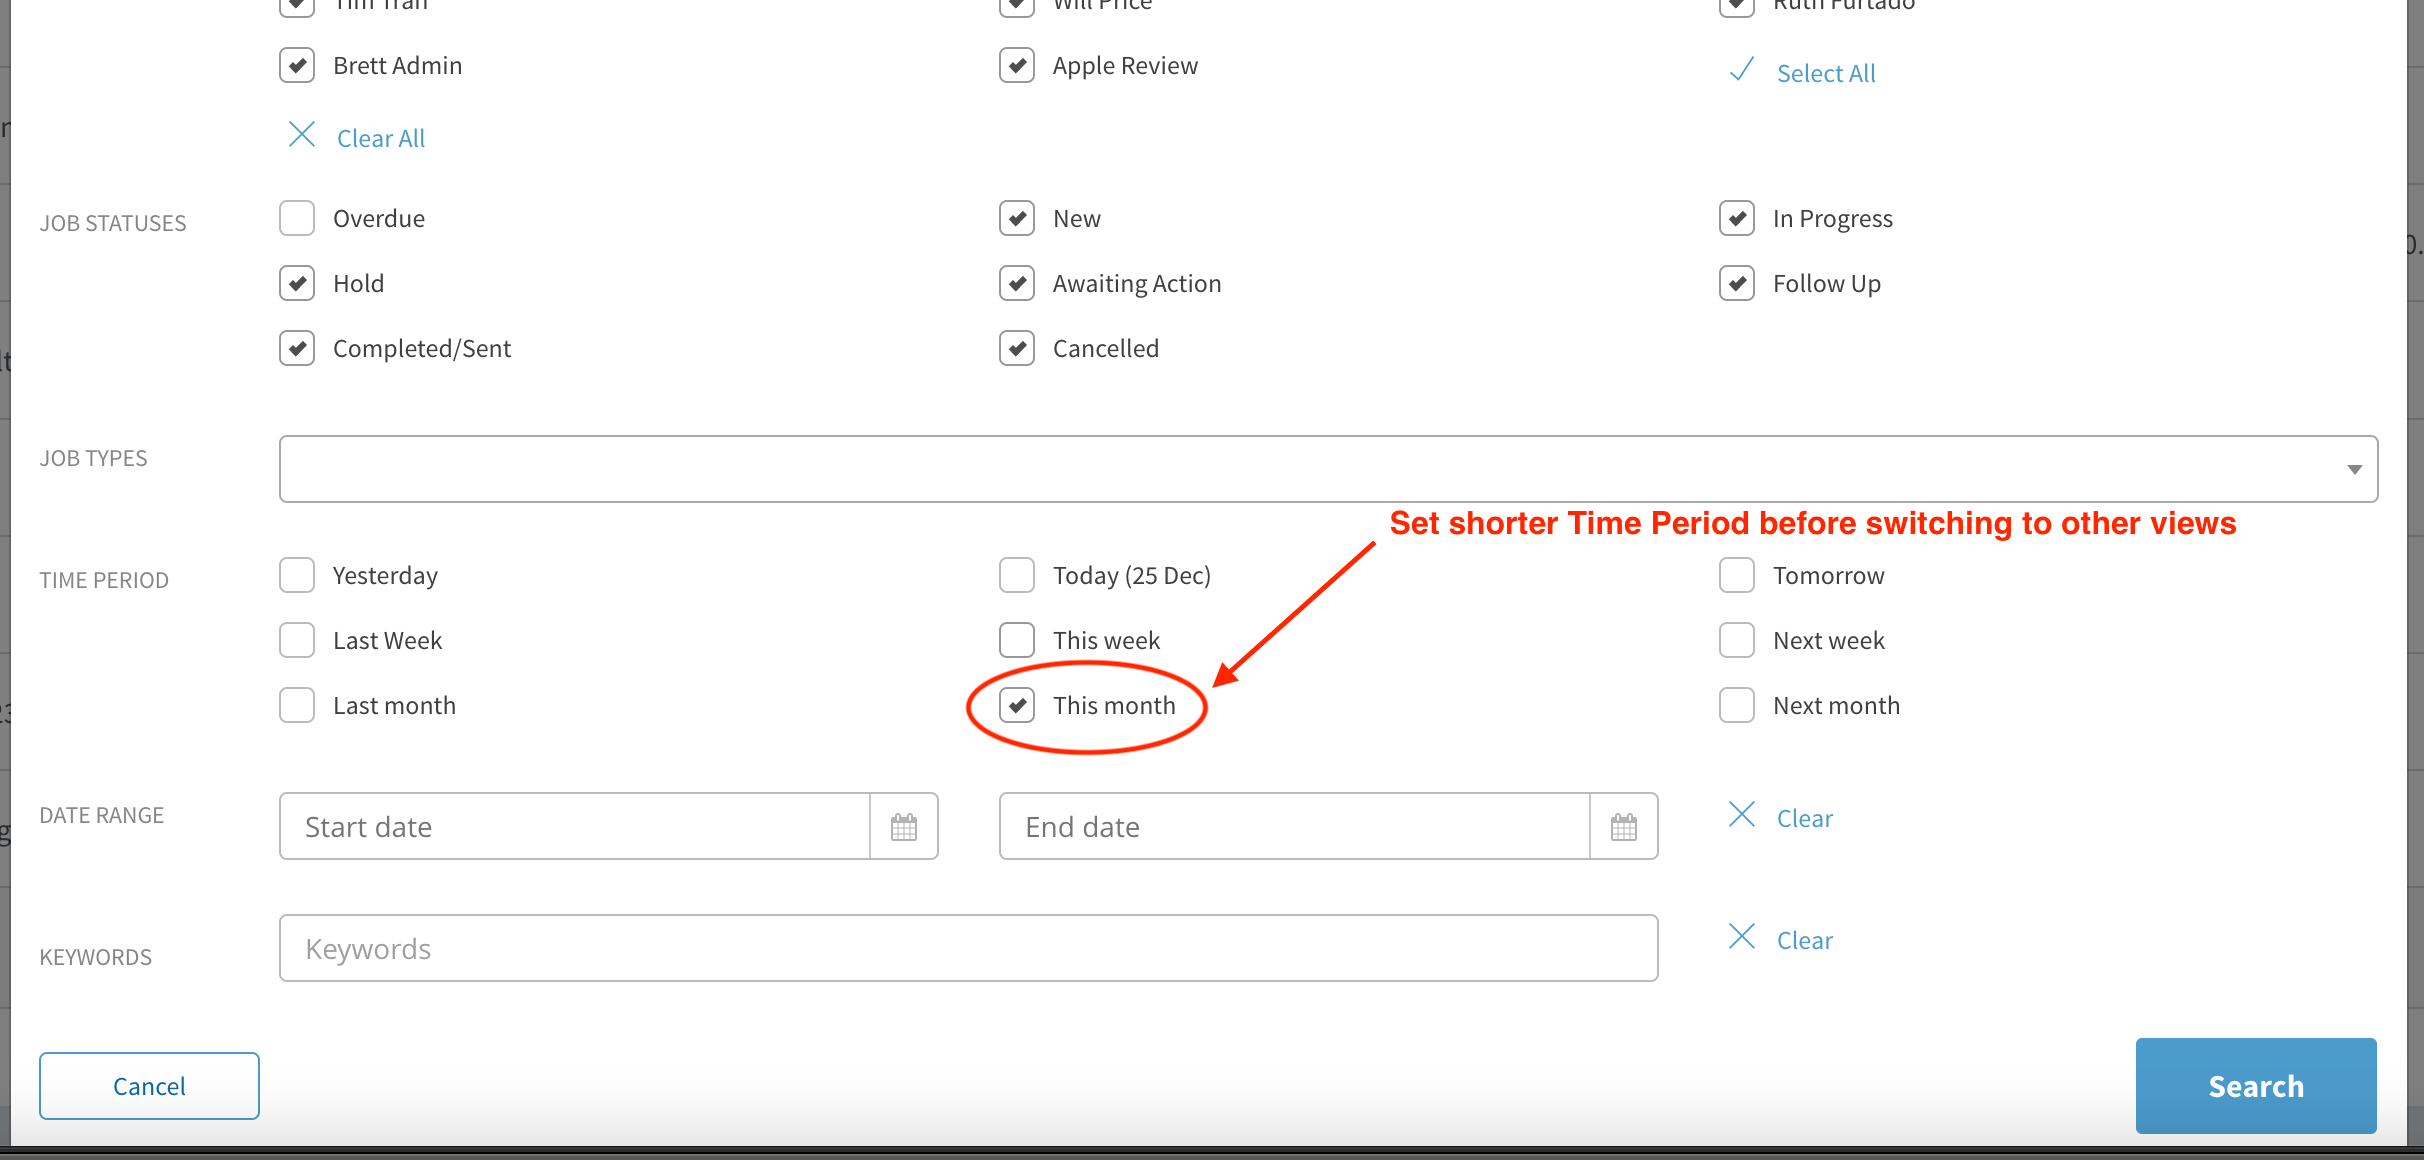
Then you can choose the job statuses that you want to include
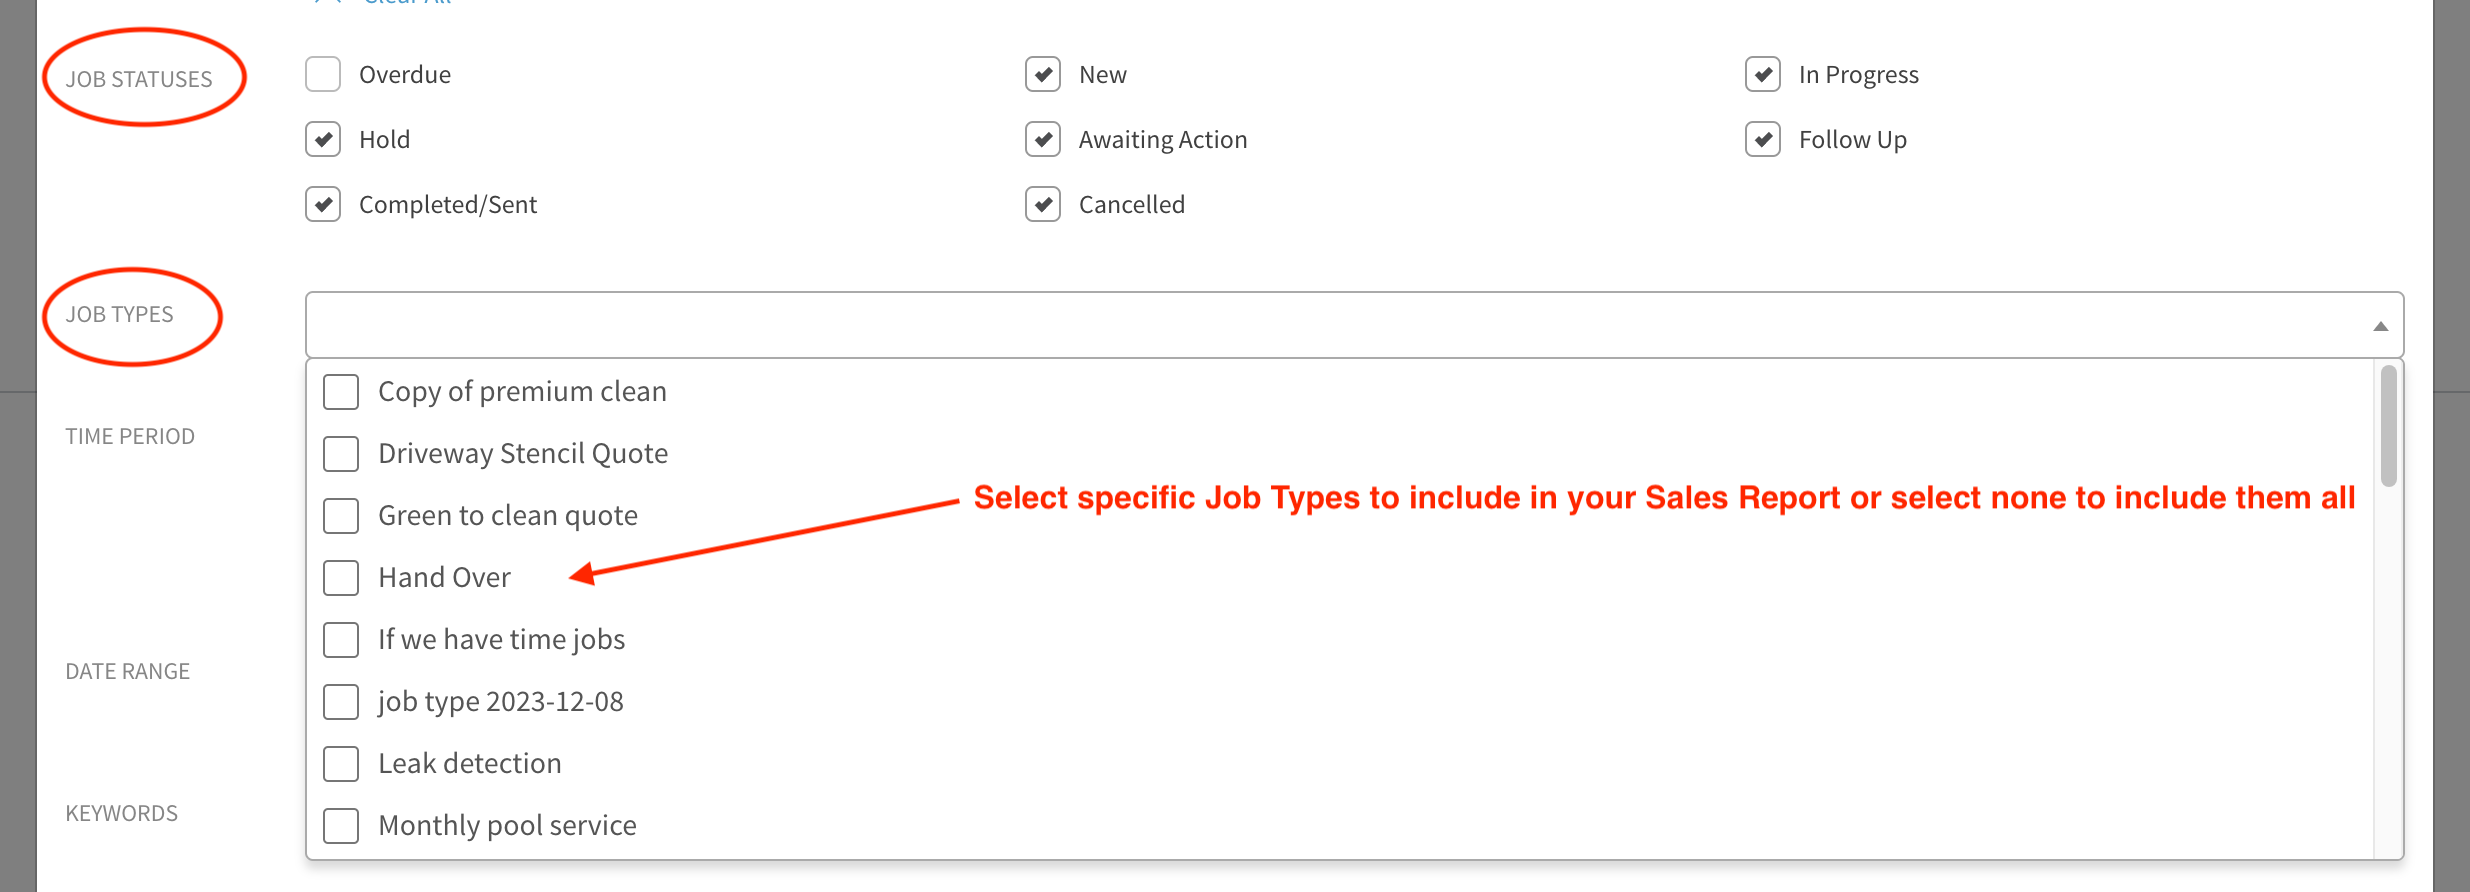
You can filter for specific job types or select none to show results for all job types
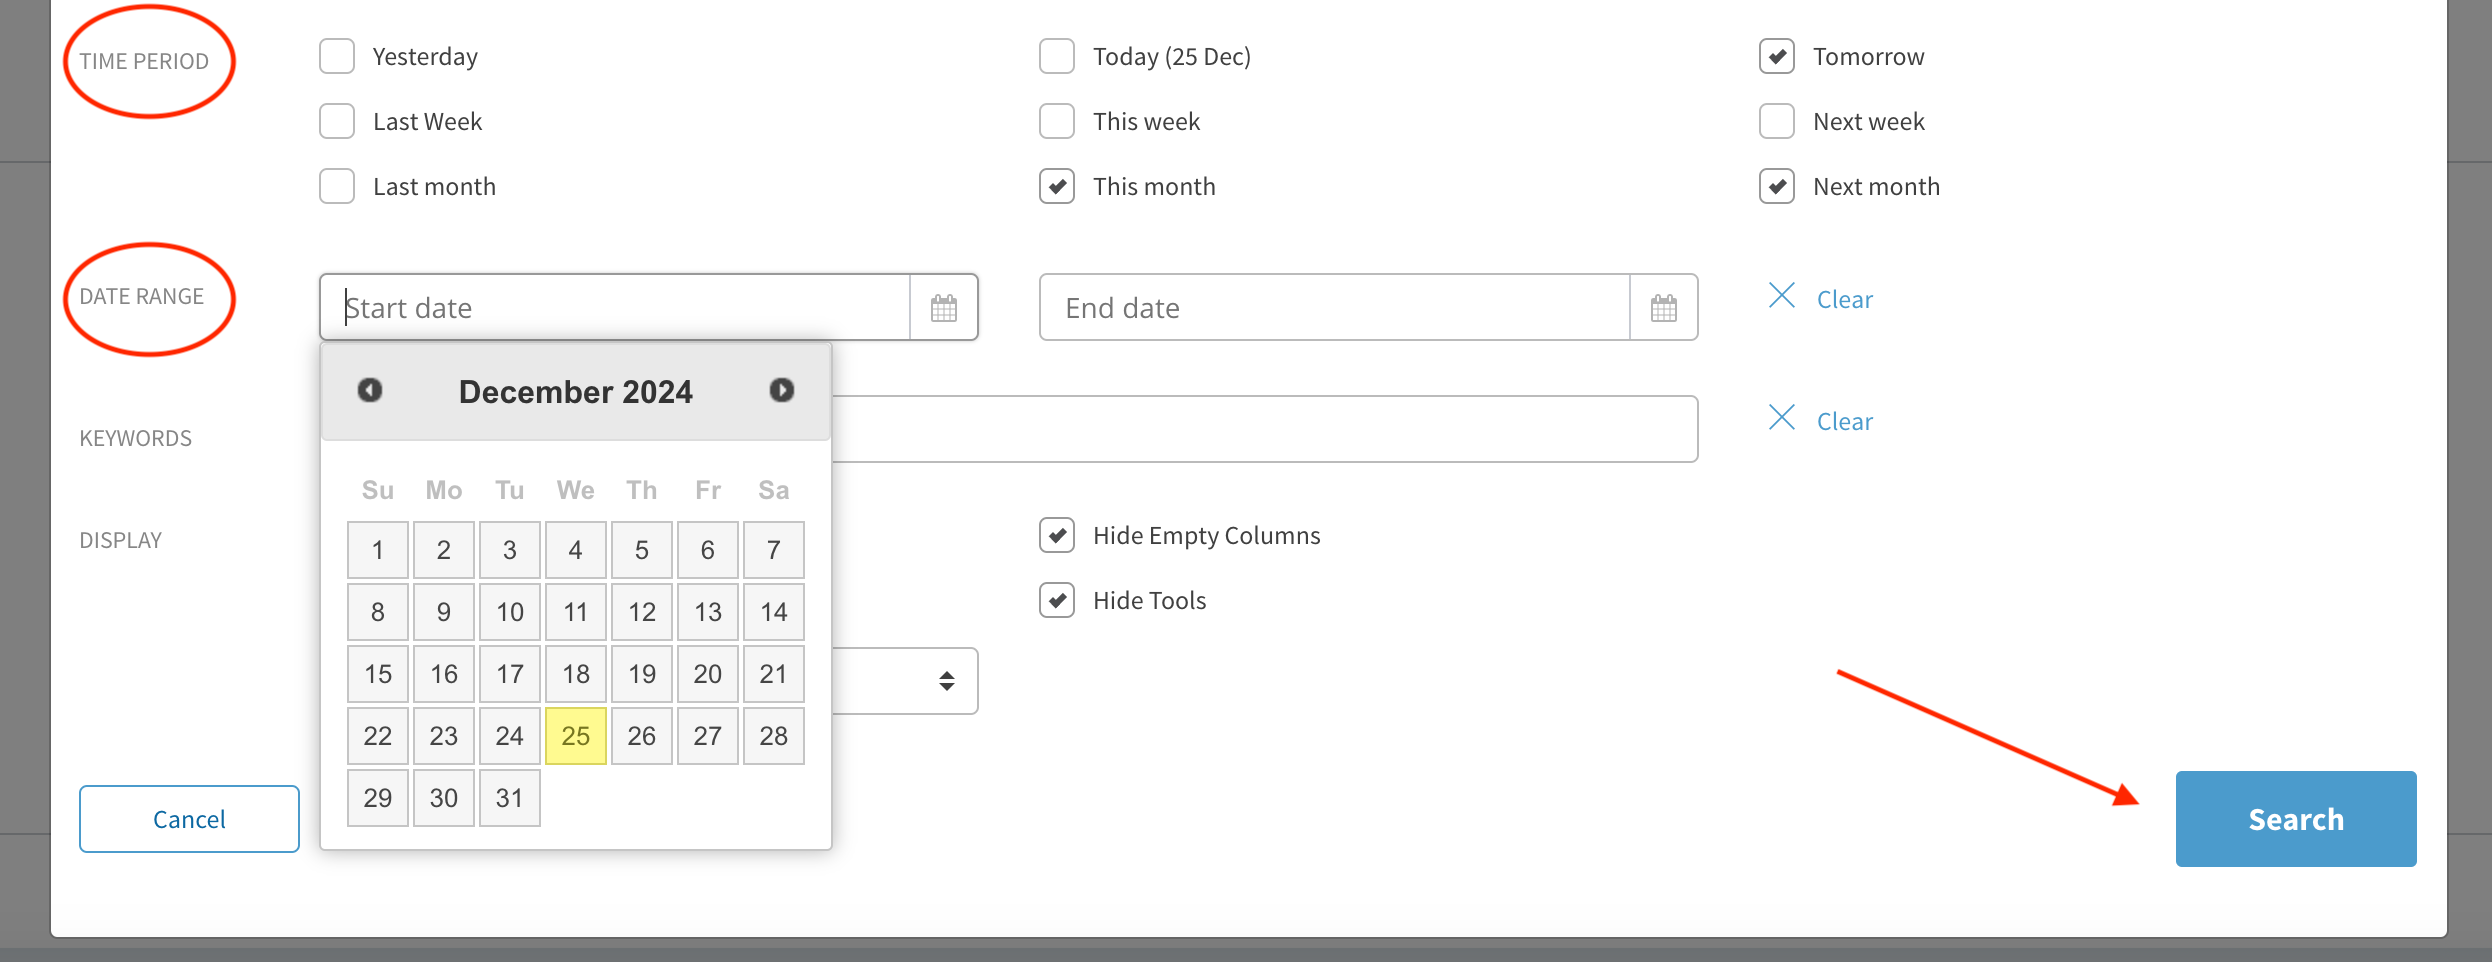
In this section you can select a specific time period …… or you can set a date range, like a specific month, I’ll select September and then hit Search
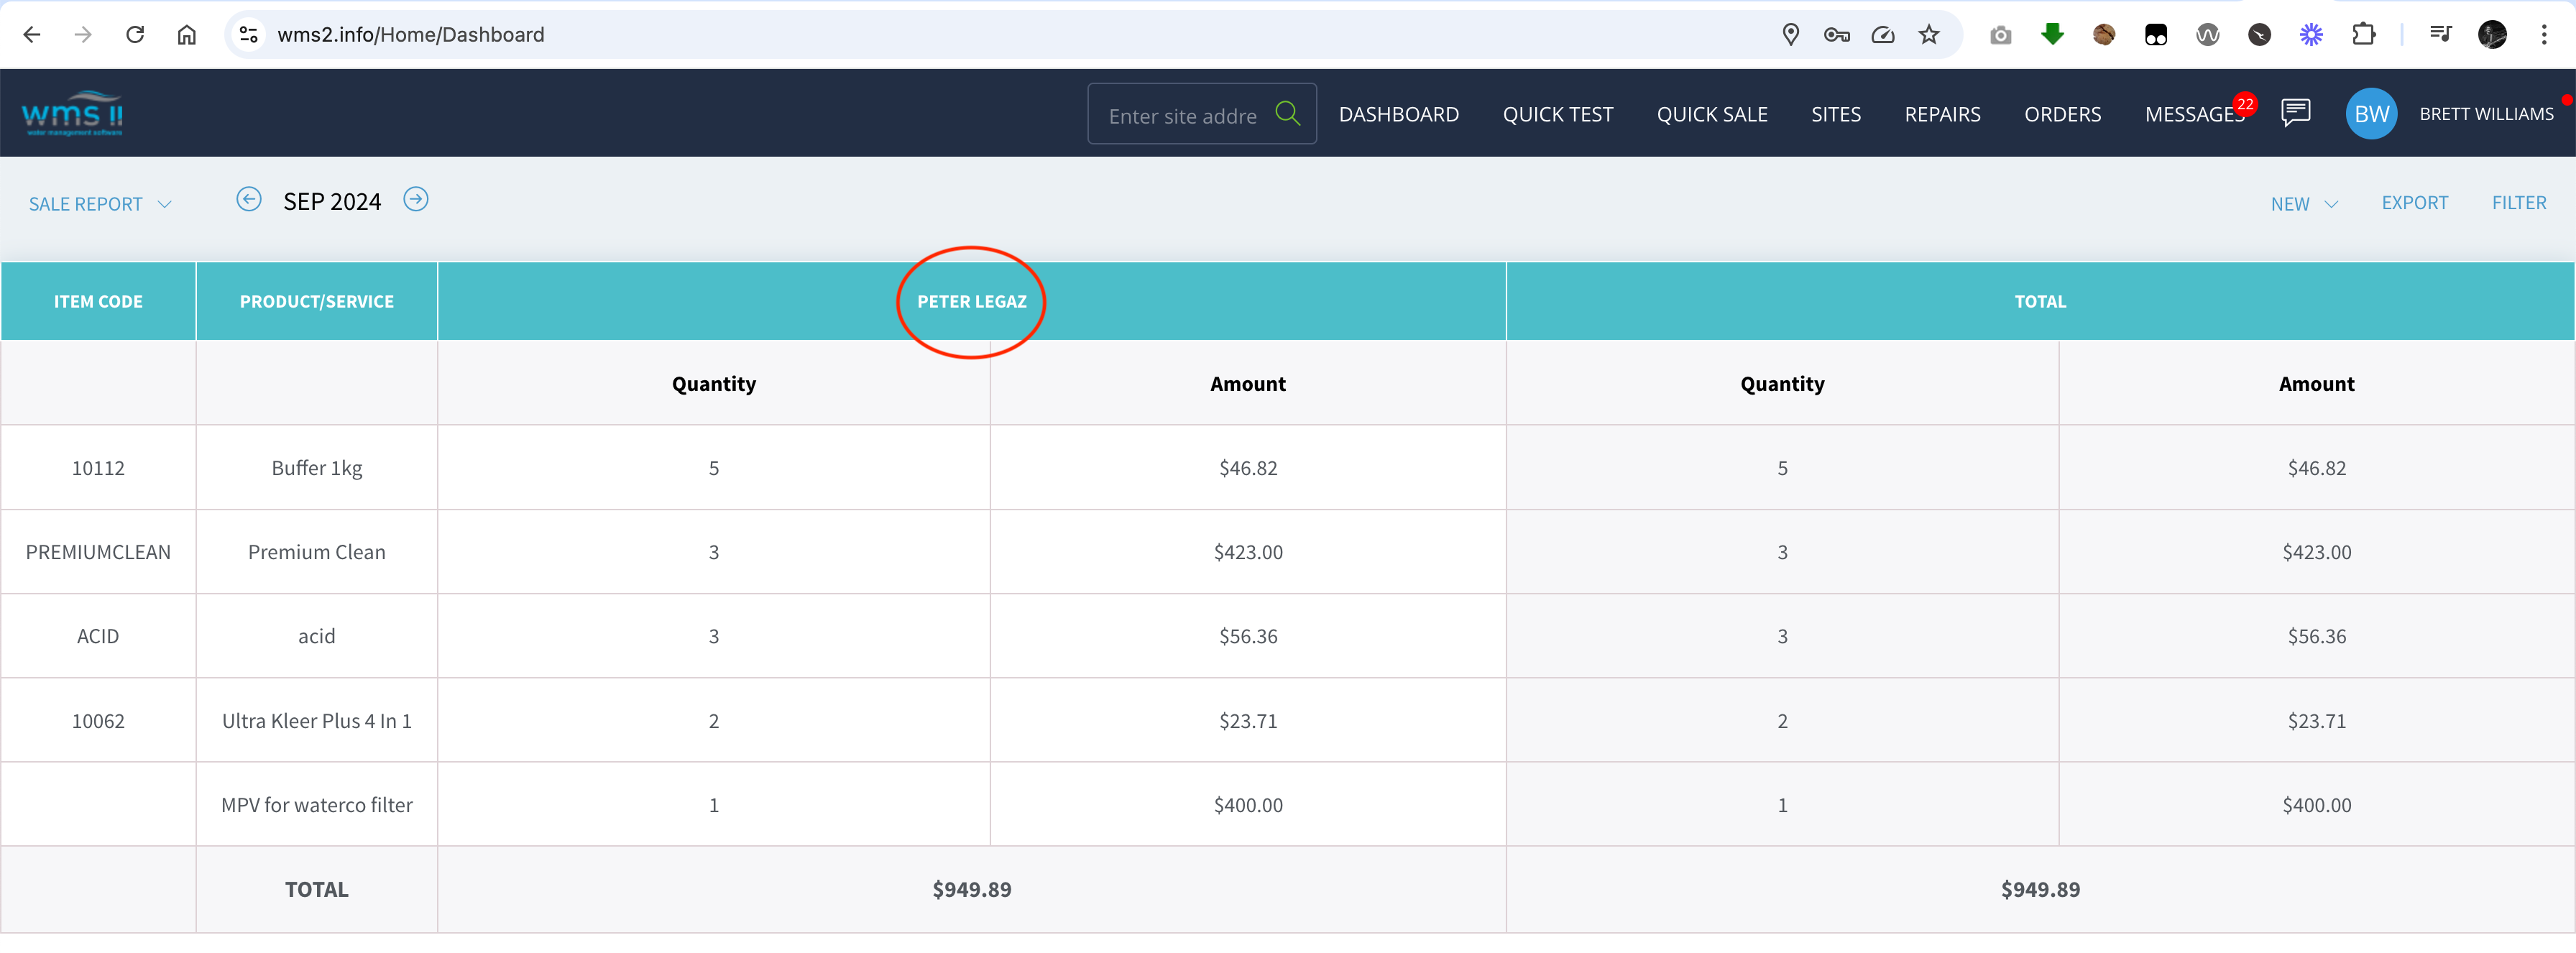
In the results you can see we have an Item Code Column and the Product or Service
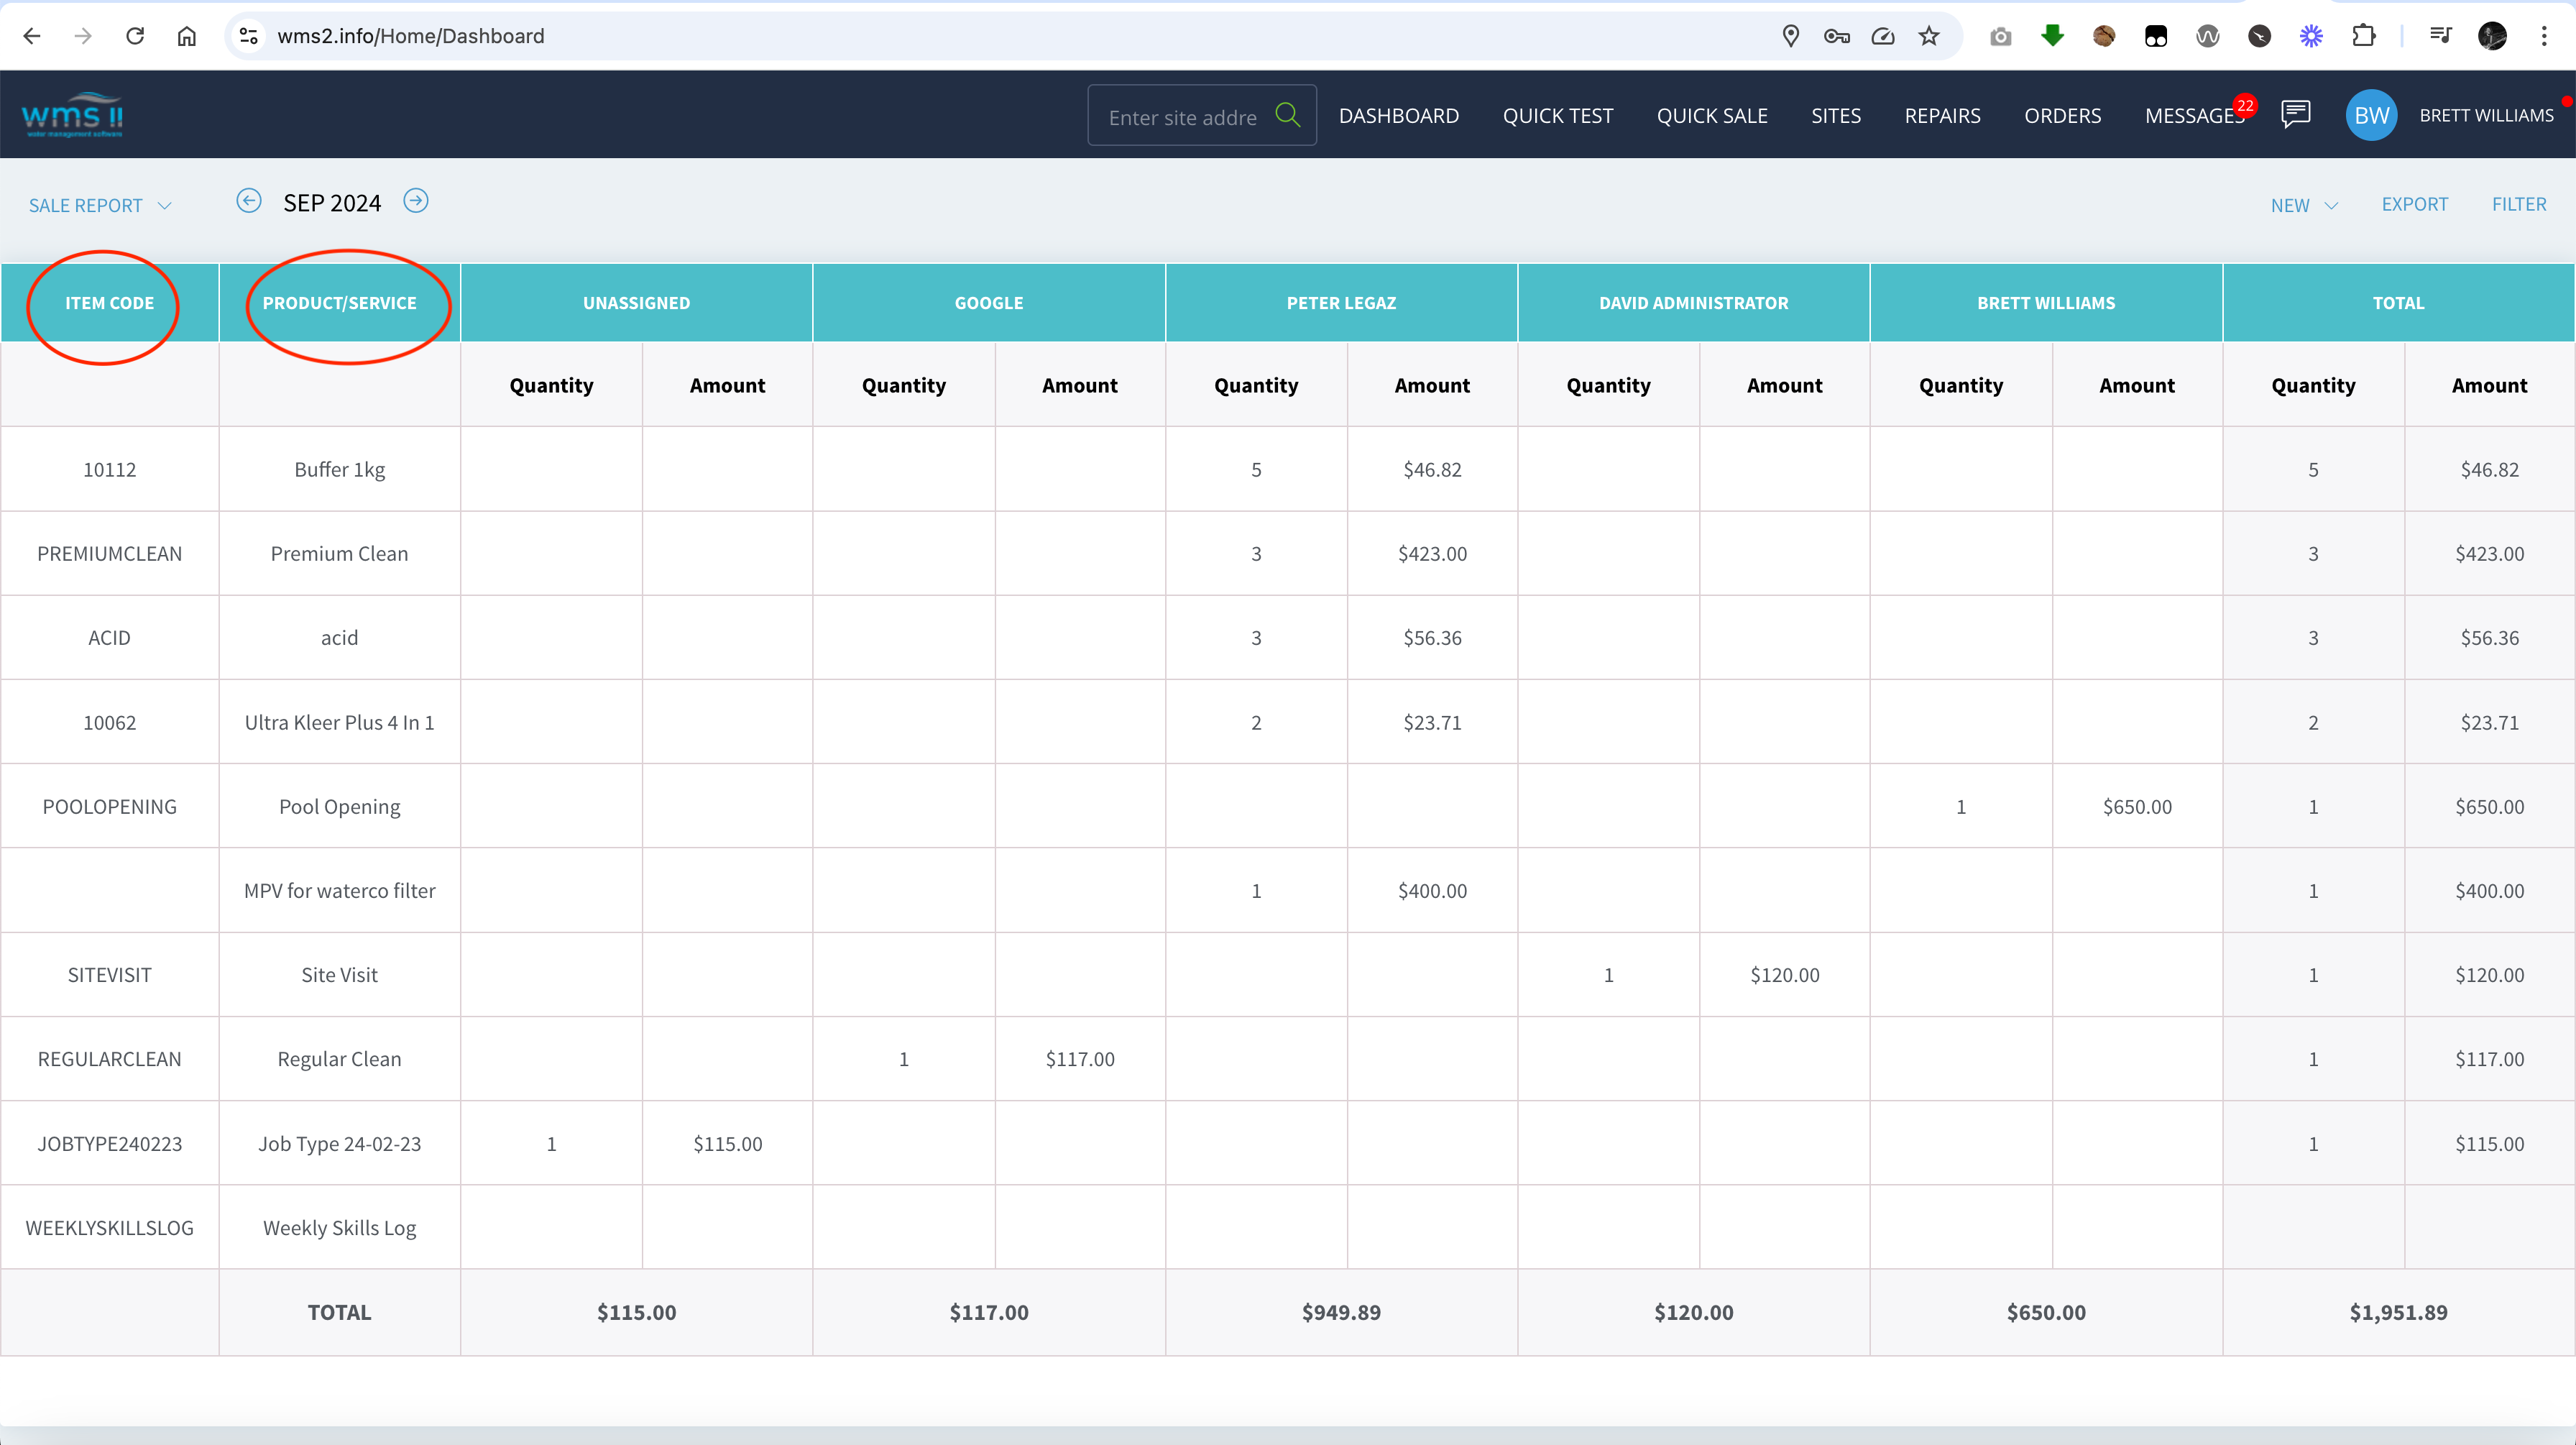
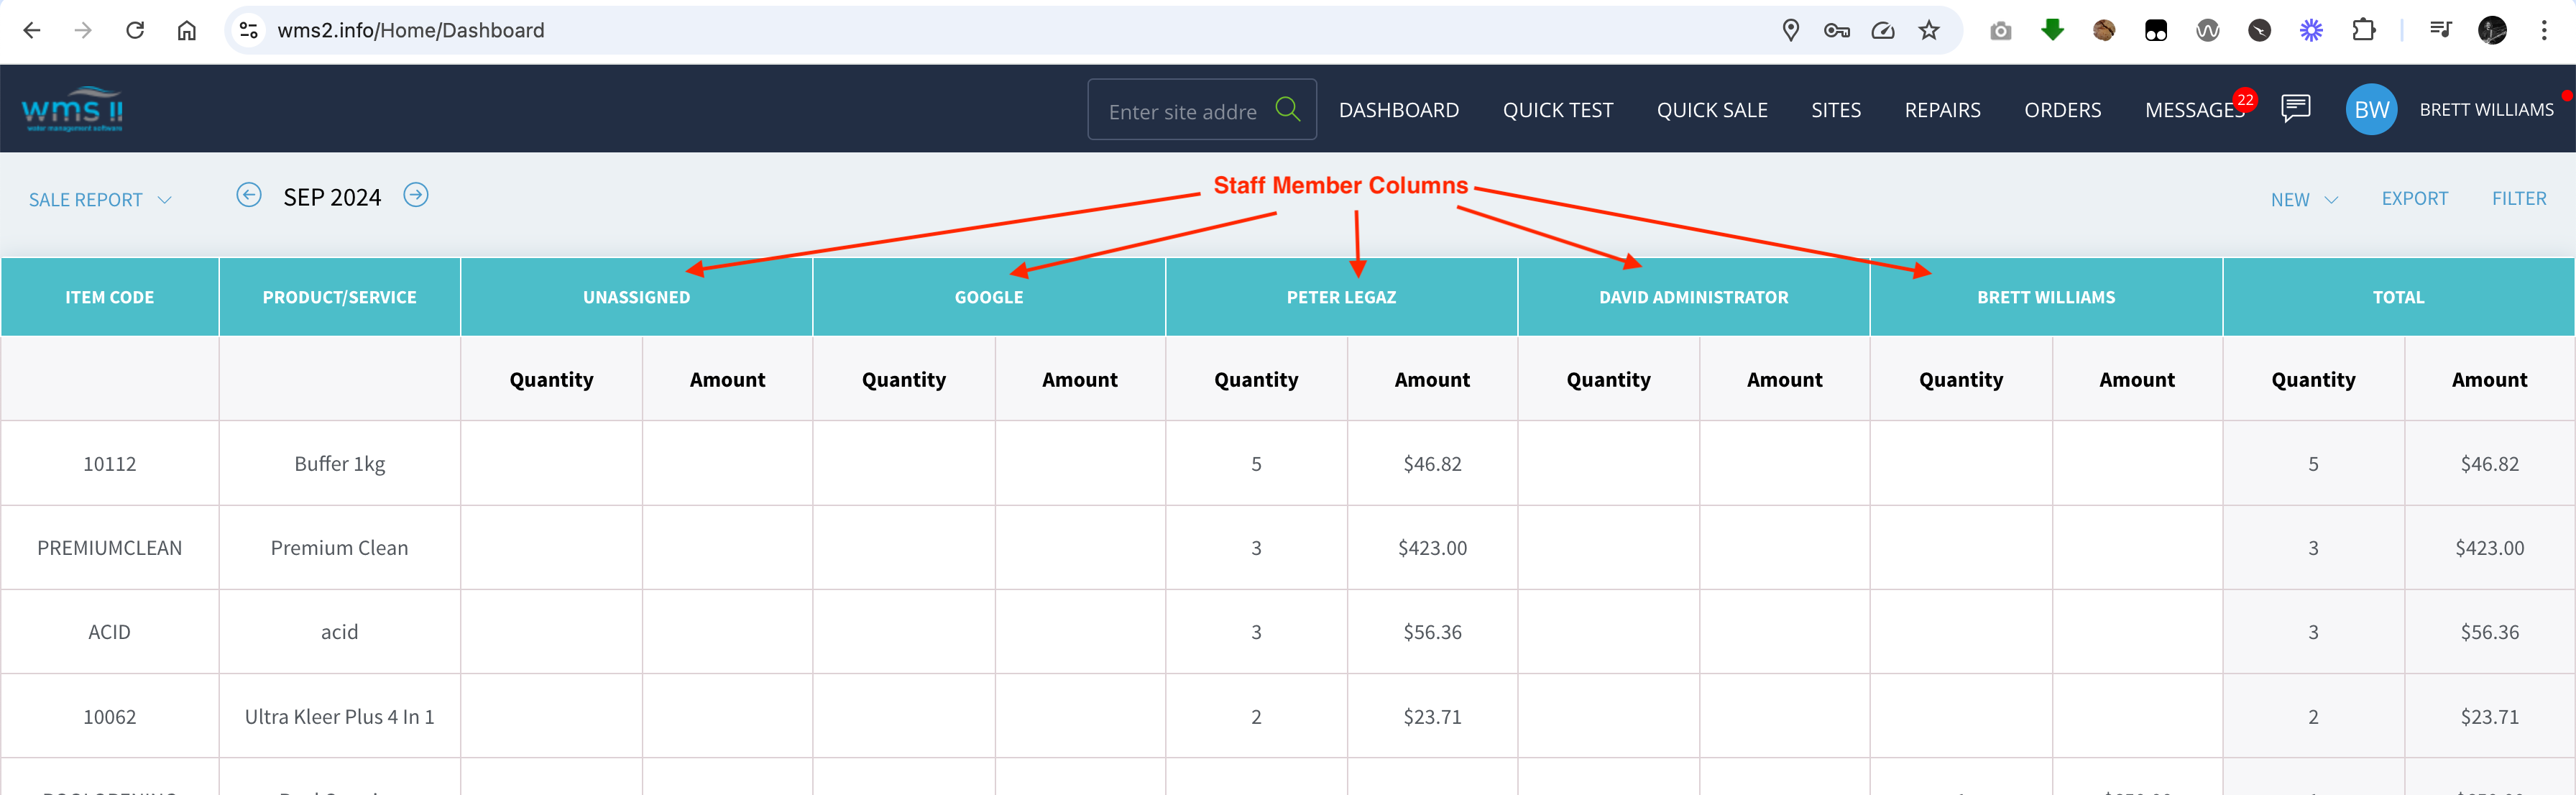
Then there is a column for each Staff Member you have selected
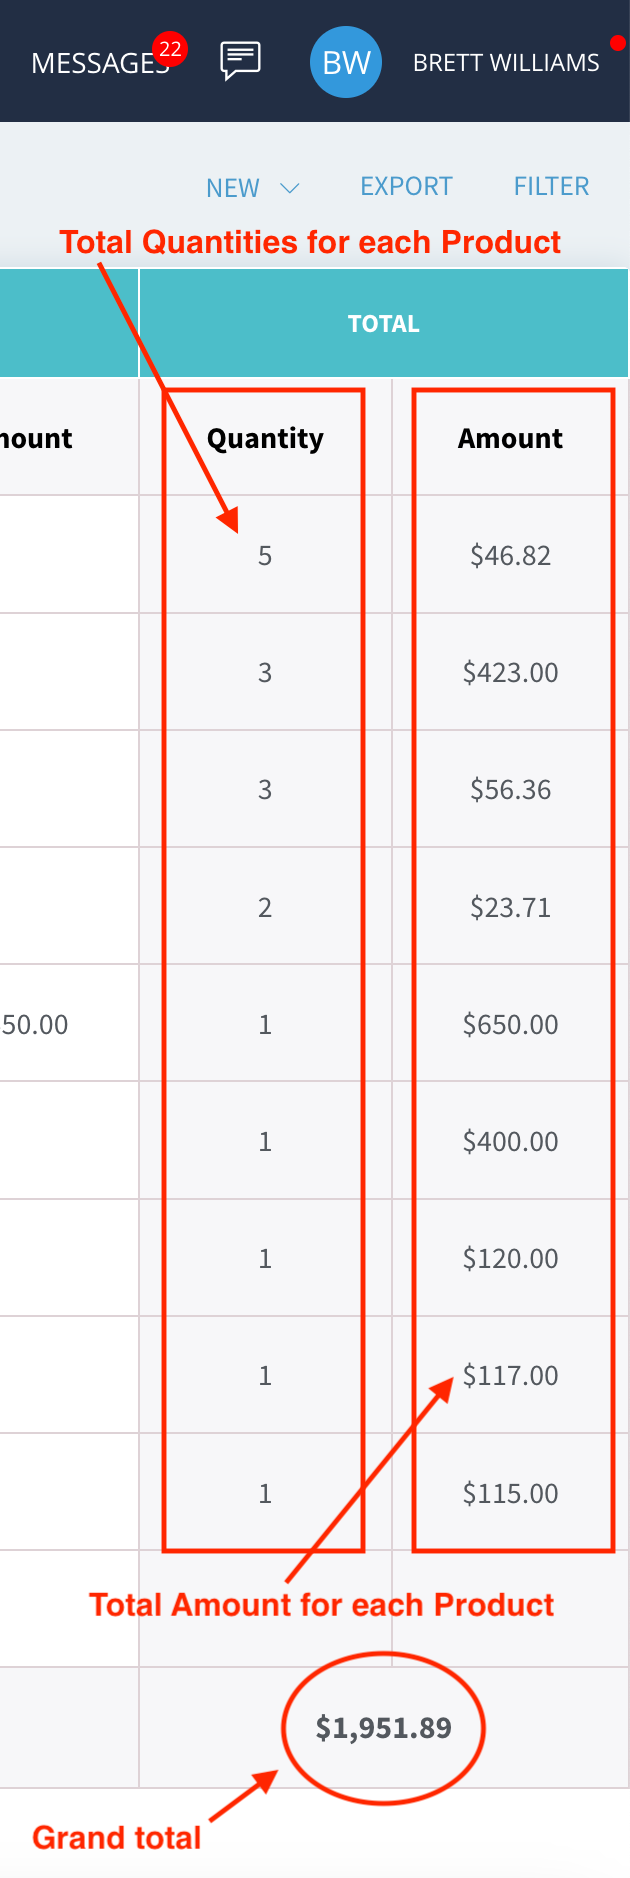
Here you can see the totals for each product sold for each Staff Member and the total sales figures along the bottom.
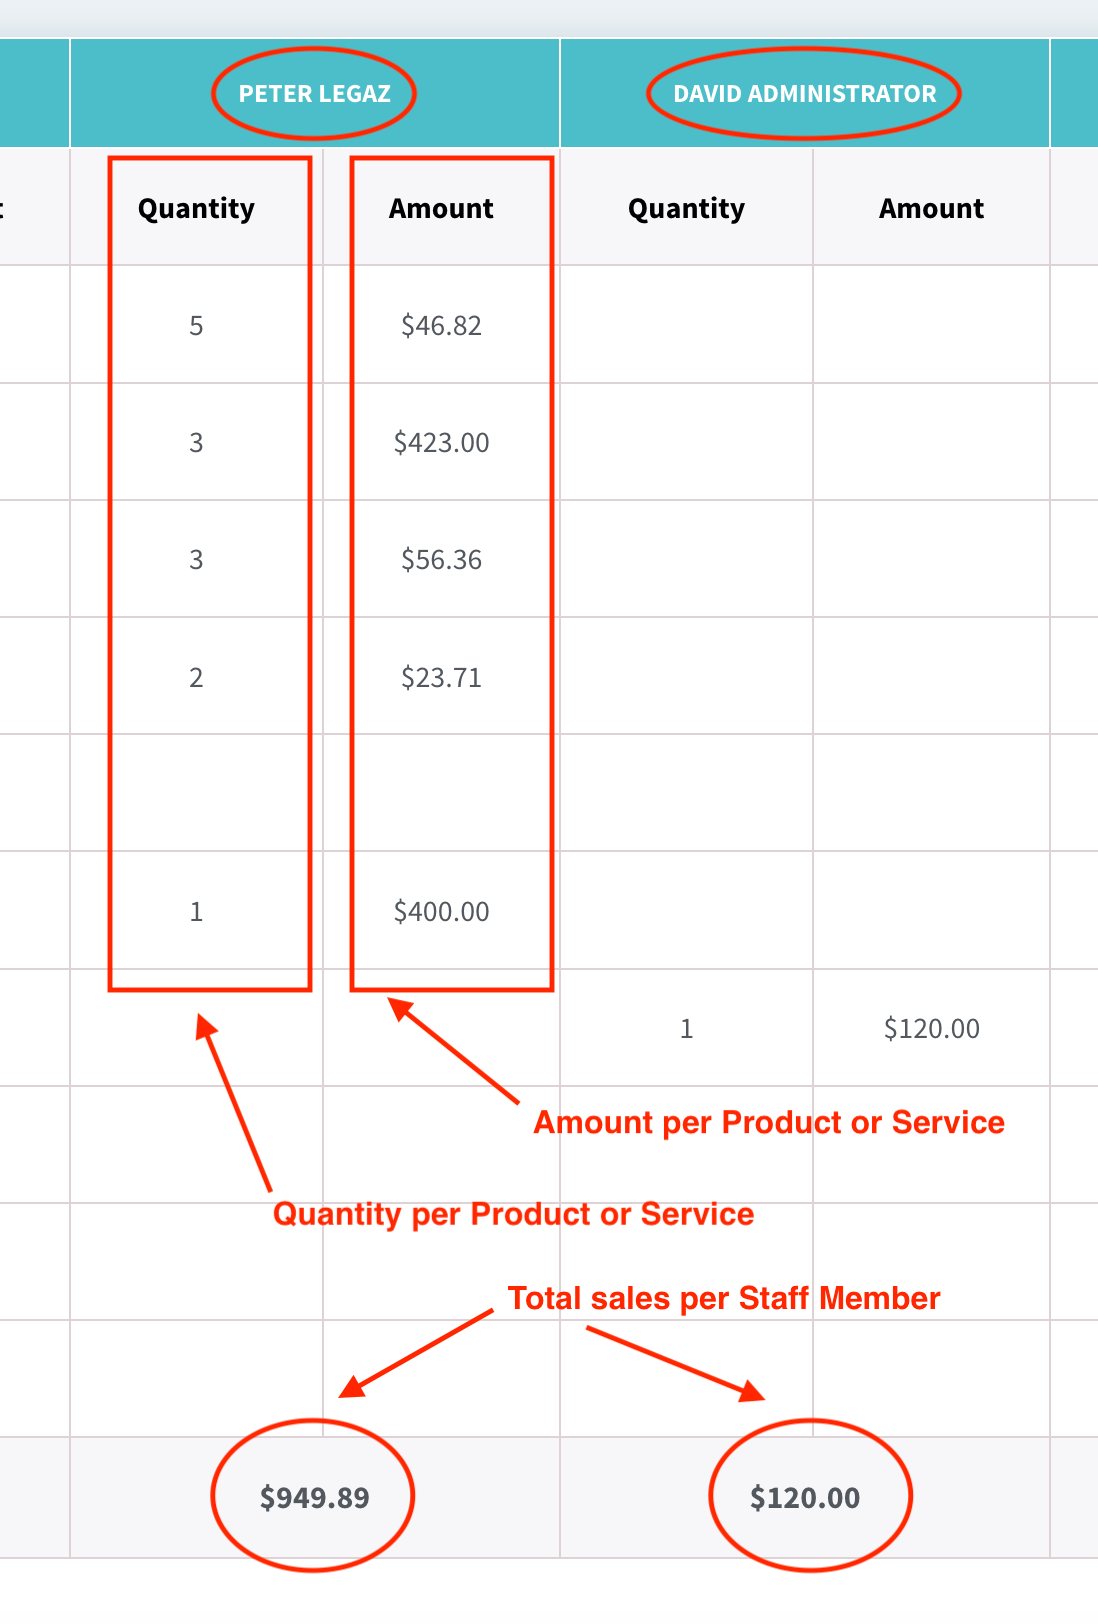
In the end column you have the total quantities and sales figures for each product
and the Grand total for all sales listed at the bottom of this column
It’s a good idea to adjust your filter before going back to job list or calendar views, especially if you’ve done a sales report for a long period of time, like a year or a quarter. If you were to leave the filter for a date range like this, the dashboard could take a long time to load so many jobs.
So we go into the filter, clear the date range and set it to something manageable, like today, this week or this month and hit search again before changing the view to Job List, Calendar or Day By Day
In another example, if you wanted to show a Sales Report for a month for just one staff member, go back to the filter, clear all, select your staff member and hit search,
Here you can see clearly all the figures for Peter’s month
And that’s basically it